

Air Transport at 52% in November
In January 2021, health restrictions had plunged the amount of air travellers in Canada. Then the partial lifting of restrictions and the arrival of summer were the wake-up calls. It was therefore from June that the recovery began to be felt. It was in mid-July that Les Ailes du Québec began monitoring data released by CATSA. Since they are updated once a week, I kept pace. But the more time passes, the more I see that a monthly update is clearly sufficient and more representative.
Thus, for the month of November, 2,299,735 passengers were screened at the 15 largest Canadian airports. This represents 52% of the 4,415,997 passengers screened in 2019. Here is the graph to compare with 2019 and to establish the progression.
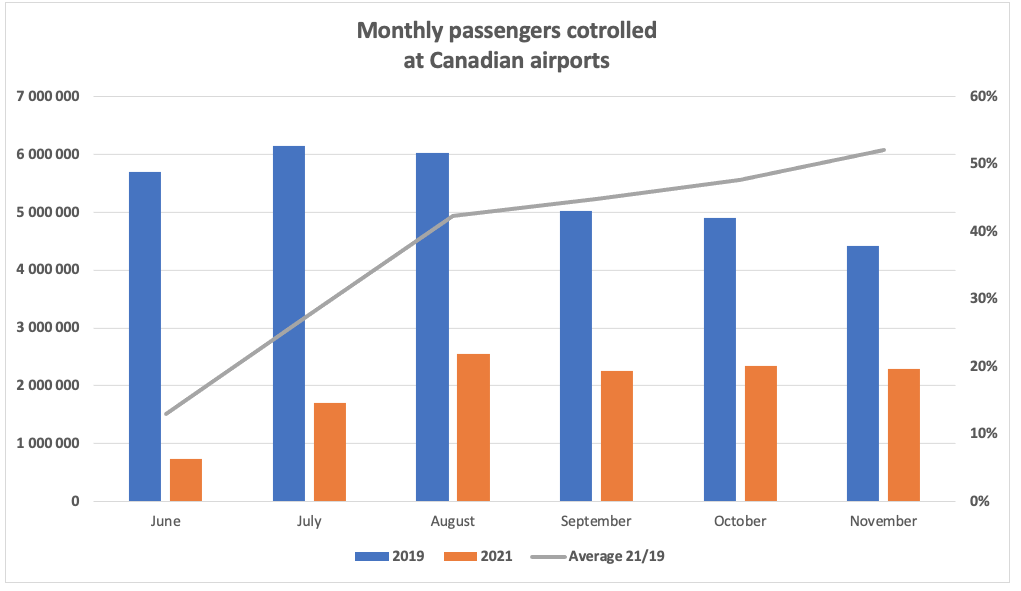
As the fall transition to air travel continues, sun destinations are attracting passengers. The first data from December indicate that the Omicron variant does not appear to disrupt the resumption of air transport. At this point in the pandemic, travellers seem more concerned about restrictive health measures than fear of the virus. In other words, Canadian air transport will continue to grow as long as the government continues to relax sanitary measures.
* What Is Measured
CATSA publishes two figures, the first is for the number of passengers at the eighth largest Canadian airports: Vancouver, Calgary, Edmonton, Winnipeg, Toronto, Ottawa, Montreal and Halifax. The second number includes the first eight airports to which are added those of Victoria, Kelowna, Saskatoon, Regina, Toronto-Billy-Bishop, Quebec and St. John’s. This data excludes aircrew and ground personnel who are controlled by CATSA.
CATSA data only includes passengers who boarded at a Canadian airport. Passengers from abroad are therefore not included in these statistics. But all the same, this is good information that allows for reliable comparisons. In order to get a clear picture, I take a daily average from week to week.
Note that airports publish their monthly statistics one month late. Toronto and Vancouver are several months behind schedule. In addition, airport authorities count revenue and non-revenue passengers; therefore there could be a difference of more than 10% between the CATSA figures and those of the airports. Click here to subscribe to our free YouTube channel
>>> Follow us on Facebook and Twitter