

A 33 % Drop For Air Transport
The tightening of health measures in Canada and the confusion that reigns are greatly affecting air transport. Thus, since the beginning of 2022, the number of passengers checked by CATSA* has been falling again. For the first 23 days of the month, the volume of passengers corresponds to 35% of that recorded for the same period in 2019. This is a drop of almost 33% if we compare to the level of last December; which implies that the airlines here find themselves once again with huge deficits.
This is on top of the fact that in 2021 airlines have been among the hardest hit in the world. Indeed, the more severe health measures and the shambles when entering the country are scared away passengers. While in the US, the volume of passengers exceeded 70% in December; here it struggled to reach 53%. This has had the effect of keeping the finances of Canadian companies in the red.
The Number of Flights Is Going Down
This is also reflected in the number of planned flights, which also fell. Data provided by Cirium indicates a 7% drop in the number of flights in two weeks. Here is the table comparing the number of flights planned by Canadian airlines for the first quarter of 2022. Take note that Air Transat had already announced a 30% cut of its flight before the 8 of January.
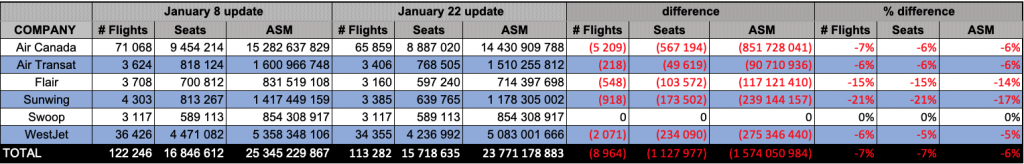
This is a relatively modest drop compared to the fall in passenger numbers. It is therefore to be expected that other flights will be withdrawn in the coming weeks. If we compare the first quarter of 2022 with that of 2019, the result is as follows:
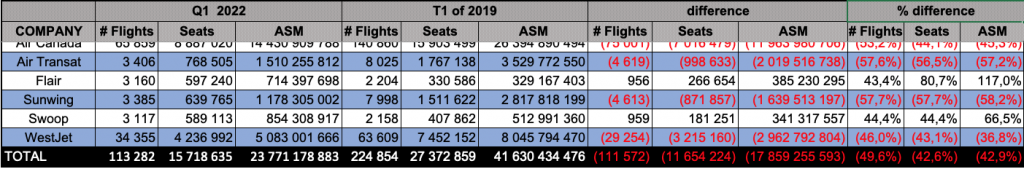
We see that Air Transat and Sunwing are the two most affected companies with a decline of 57.7%. This is normal since these carriers do not have volume on domestic flights. Their clientele is international and therefore very affected by health measures. With a decline of 53% and 46% respectively for Air Canada and WestJet, the situation is not much better. I don’t have the statistics for the occupancy rate, but the CATSA figures provide a clue; it must be falling sharply too.
Tomorrow, I’ll talk to you about Air Transat’s first and its deteriorating financial situation.
* What is measured
CATSA publishes two figures, the first is for the number of passengers at the eighth largest Canadian airports: Vancouver, Calgary, Edmonton, Winnipeg, Toronto, Ottawa, Montreal and Halifax. The second figure includes the first eight airports plus Victoria, Kelowna, Saskatoon, Regina, Toronto-Billy-Bishop, Quebec and St. John’s. This data excludes aircrew and ground staff who are screened by CATSA.
CATSA data only includes passengers who boarded at a Canadian airport. Passengers from abroad are therefore not included in these statistics. But it is still good information that allows for reliable comparisons. In order to have a clear portrait, I do a daily average from week to week.
Note that airports publish their monthly statistics one month late. Toronto and Vancouver are several months behind. In addition, airport authorities count paying and non-paying passengers; therefore, there could be a difference of more than 10% between the CATSA figures and those of the airports.
>>> Follow us on Facebook and Twitter